
Shineyrock
web design & consultancy
Shineyrock
blog
- like 11
Using New Relic to Monitor Your Servers
A running application is not just a bunch of code, the code also has to run somewhere. I am talking about your production servers. It is just as important to ensure that your production boxes are behaving themselves as it is to make sure that your application code is performant. You can set up systems like Nagios to help you with this, but these can be extremely complex to work with, require significant infrastructure of their own and can be total overkill (unless your infrastructure needs are extremely complex). New Relic provides a less full-featured but very simple alternative when it comes to infrastructure monitoring.
If you've read some of our previous articles on New Relic, you should be right at home with how the New Relic dashboards work. The server monitoring dashboards use the same concepts. If you're already using New Relic, you can begin receiving data about your server performance very quickly. Even if you haven't previously set up New Relic, it may be worth using it just for server monitoring. The six or so dashboards that New Relic provides can significantly delay (or even entirely remove) the need for a more full-featured infrastructure monitoring solution.
Why Do I Need a Service to Monitor Boxes at All?
Depending on the needs of your application, you may have a web component, database, cache, search, load balancer, etc. Some of these may share the same box. But, once your application gets beyond a certain size, you will start putting some of these on their own boxes. When you only have one production server things are easy. You SSH into that box, run a few shell commands and get a pretty good idea regarding the health of that one server. As the number of boxes grows this can become a bit of a chore. It would be handy if you could have a way to find out about the health of all your boxes at once. This is exactly the problem that New Relic server dashboards solve. You get a snapshot of the health of all your production servers at once.
Of course, manually checking the health of all your servers is not the most efficient thing to do. When things go wrong, you want to find out as soon as it happens, not the next time you decide to check. Most infrastructure monitoring systems have a way to send alerts when particular parts of the monitored servers fail (e.g., disk full, using too much RAM etc). New Relic is no different. You can use the very flexible, alert policy infrastructure to send failure notifications in any way you like, such as email, web hooks etc.
Lastly, infrastructure issues often don't appear suddenly, historical context is important. RAM will slowly get eaten up for hours before the box begins to fail, the disk will fill up for days before things come to a head. Spot checking your servers does not give you the historical context you need to prevent the issues from happening. If you just happen to check the disk usage when it's getting a bit full, you can do something about it. If not, you only learn about the problem when your boxes die. New Relic collects data and sends it back to their servers all the time, so the dashboards are all about historical context. This makes it very easy to preempt certain classes of problems.
It Works in Real Life
Let me tell you a couple of stories. We use New Relic in Tuts+ for both application performance monitoring and server monitoring. A few months ago I was on call, when our boxes started misbehaving every few minutes. They weren't quite falling over, but the application would perform very poorly for short periods of time. I logged on to the boxes and found that the memory usage was very high. So I rebooted the servers one by one and things seemed to be ok for a while. But a few hours later it all started happening again. This smelled like a memory leak.
So I logged in to New Relic to have a look at the graphs. Sure enough, one of the deploys we did previously had introduced a memory leak into the application. It would take a few hours for all the memory to be consumed by the application at which point it would go into a desperate garbage collection frenzy, causing all sorts of funny issues. Looking at the memory graphs on all the boxes it was immediately obvious what was happening. At the time we didn't have any alerts set up (we do now), so we didn't become aware of the problem until it caused other issues to manifest. But, being able to compare all the boxes to each other, as well as having the historical context, let me easily diagnose the problem, roll out a fix and get to sleep on time that night.
Here is another one. Recently there was an outage in the AWS datacenter where Tuts+ is hosted. When things finally settled down, we rebooted all the boxes to make sure there were no niggling issues. But when the boxes came back, the application would intermittently return 500 responses or perform very poorly some of the time. This was likely an issue with one or more of the servers, which is very annoying to diagnose when you have many boxes. Once again, looking at New Relic allowed us to surface the issue very quickly. One of our boxes came back with a rogue process which was consuming a lot of CPU, causing the app on that box to perform poorly. Another box was affected by some sort of AWS glitch which caused the disk IO utilization of that box to be 100%. We took that box out of our load balancer, got rid of the rogue process on the other one and the application started to perform fine again.
The graphs New Relic provides are truly useful and I wouldn't want to do without them, so let me show how to get server monitoring up and running.
Installing the New Relic Server Monitoring Agent
Basically it all comes down to logging on to your server and installing the New Relic server monitoring daemon (
nrsysmond). If you've read the New Relic for PHP article, the procedure is almost identical. As usual, let's assume we're on Ubuntu.The first thing to do is to import the New Relic repository key:
wget -O - https://download.newrelic.com/548C16BF.gpg | sudo apt-key add -
Now we add the New Relic repository itself to the system:
sudo sh -c 'echo "deb http://apt.newrelic.com/debian/ newrelic non-free" > /etc/apt/sources.list.d/newrelic.list'
Now we just use
apt:sudo apt-get update sudo apt-get install newrelic-sysmond
After it's finished installing, you will get a nice message like this:
*********************************************************************
*********************************************************************
***
***  Can not start the New Relic Server Monitor until you insert a
***  valid license key in the following file:
***
***     /etc/newrelic/nrsysmond.cfg
***
***  You can do this by running the following command as root:
***
***     nrsysmond-config --set license_key=<your_license_key_here>
***
***  No data will be reported until the server monitor can start.
***  You can get your New Relic key from the 'Configuration' section
***  of the 'Support' menu of your New Relic account (accessible at
***  https://rpm.newrelic.com).
***
*********************************************************************
*********************************************************************
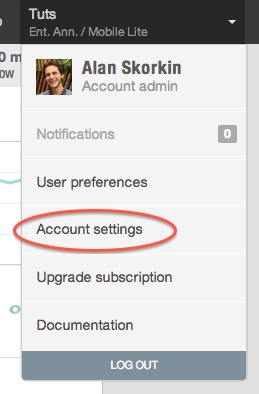
Let's do what it says. Firstly, let's jump into our New Relic account settings to look up our license key (it will be on the right):
Now let's run the command:
nrsysmond-config --set license_key=<your_license_key_here>
If you check the config file now:
/etc/newrelic/nrsysmond.cfg. You'll see your license key in there. We're ready to start the agent:/etc/init.d/newrelic-sysmond start
You can now check your process list to make sure it is running:
ps -ef | grep nrsys
newrelic 10087     1  0 09:25 ?        00:00:00 /usr/sbin/nrsysmond -c /etc/newrelic/nrsysmond.cfg -p /var/run/newrelic/nrsysmond.pid
newrelic 10089 10087  0 09:25 ?        00:00:00 /usr/sbin/nrsysmond -c /etc/newrelic/nrsysmond.cfg -p /var/run/newrelic/nrsysmond.pid
ubuntu   10100  9734  0 09:25 pts/1    00:00:00 grep --color=auto nrsys
As per the PHP agent, there are two processes. One is a monitor process and the second is the worker. The worker actually does the job of communicating with the New Relic servers, the monitoring process simply watches the worker and if the worker dies, for whatever reason, it will spawn a new one.
We can also check the logs to make sure there were no errors on startup:
cat /var/log/newrelic/nrsysmond.log
2014-05-25 09:25:02 [10089/main] always: New Relic Server Monitor version 1.4.0.471/C+IA started - pid=10089 background=true SSL=true ca_bundle=<none> ca_path=<none> host=ip-10-196-10-195
2014-05-25 09:25:03 [10089/main] info: RPM redirect: collector-102.newrelic.com(50.31.164.202) port 0 (0 means default port)
Everything looks fine, and you should now start seeing data appear in the New Relic UI.
Configuring the Server Monitoring Agent
Most of the time you won't need to configure anything else beyond the license key, but if you do need to up the log level or configure a proxy, it is definitely possible. It all lives in
/etc/newrelic/nrsysmond.cfg. The file is very well commented and pretty self-explanatory. If you do change anything, remember to restart the daemon:/etc/init.d/newrelic-sysmond restart
There is only one subtle thing when it comes configuring server monitoring and that's the name of the server, as it will be seen in the New Relic dashboards. By default New Relic will take the hostname of the box and make that the name of the server in the dashboards (i.e., the output of the
hostnamecommand). I recommend you keep it this way. If you're also using New Relic for application monitoring, keeping the hostname, as output by thehostnamecommand, as the name of the server will ensure that New Relic can correctly work out which applications are running on which boxes and link everything up properly in the UI.If you really have to, you can change the name of the server as it will appear in the UI by setting the
hostname=parameter in the configuration file:/etc/newrelic/nrsysmond.cfg. You will need to restart the daemon for this to take effect. You can also modify the name of the server directly in the UI which won't affect the daemon.Using the Server Monitoring Dashboards
The first thing you see when you click the Servers link on the left is a snapshot of all your servers and the key metrics for all of them (CPU, Disk, Memory, IO).
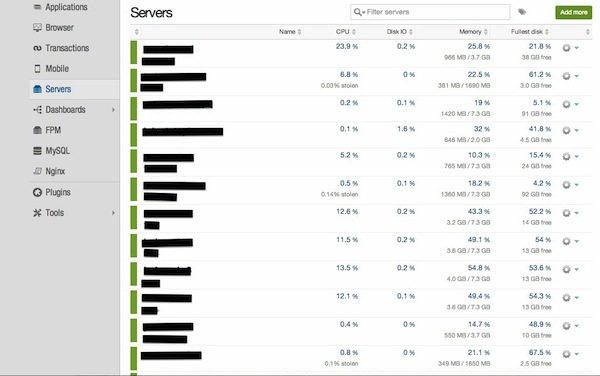
This page can let you see if one or more of your boxes are obviously misbehaving. Here you can also rename a server or add tags to it, if necessary.
If we click on one of the servers, we come to the main server dashboard:

There are six main metrics here:
- CPU usage
- Memory usage
- Disk IO utilization
- Network IO
- Load average
- Process List
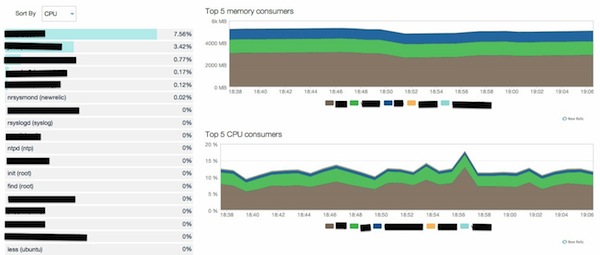
This will give you a quick overview of a particular server. You can drill down into each of the graphs to get more information. For example, you can drill down into the CPU graph to see which processes are using the CPU:
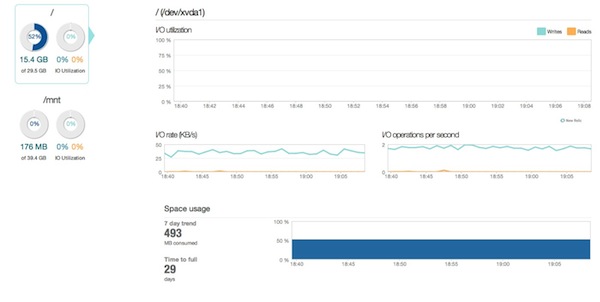
Or you can drill down into the disk graph to see your IO rate, a breakdown of reads and writes, as well as get an estimate of how long it will be before your disk is full.
The best part is you can use the same operations on all these graphs as you can on application-level graphs. So, you can zoom in on a five minute window to look at a CPU usage spike more closely, or you can have a look at a seven day trend in memory usage.
The best part is, the graphs are simple to understand, you're not overwhelmed with metrics and you can compare similar boxes to each other. This can help you diagnose 99% of common problems you're likely to encounter with your infrastructure.
Setting up Server Monitoring Alerts
New Relic has recently done a lot of work to improve their alerting capabilities. Alert policies is what they've come up with across their whole system (e.g. there are application alert policies for application and server alert policies for boxes). It may be a little confusing at first, but it is pretty simple once you get the hang of it. There are two main concepts, policies and channels. In terms of server alerts, it works like this:
We set up a policy and assign some servers to it:
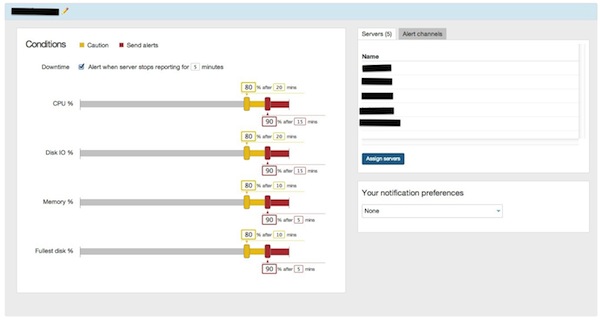
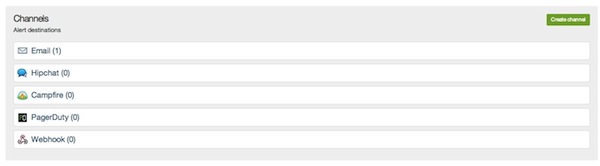
You also create a channel (e.g. email, webhook) to which alerts can be sent:
You then assign a channel to a policy. From that point on, depending on the settings for the channel (e.g. first critical event, all critical events, downtime only). You will get notifications on that channel.
The only confusing bit about alert policies is where to find them. They live under Tools->Alert Policies:
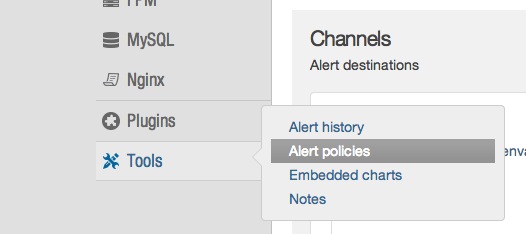
You then need to click on Servers in the menu at the top, to find server alert policies.
Conclusion
If you're already using an infrastructure monitoring solution like Nagios and it's working well for you, then you may not get too much extra from New Relic server monitoring (although the graphs and historical trends are pretty excellent). However, if you're not monitoring your infrastructure at all or your current solution isn't working for you, definitely give New Relic a try. For me, it has become the first tool I go to when I suspect that something is wrong with my servers. And often enough, it will let me know that trouble is brewing before the situation becomes critical. As developers, that's the kind of tools we all want in our arsenal.

martijn broeders
founder/ strategic creative at shineyrock web design & consultancy
e-mail: .(JavaScript must be enabled to view this email address)
phone: 434 210 0245

By - category
By - date
December, 2023
The Best Small Business Web Designs by DesignRush
/ 3
3October, 2022
Create Modern Vue Apps Using Create-Vue and Vite
/ 5September, 2022
Pros and Cons of Using WordPress
/ -3
-3How to Fix the “There Has Been a Critical Error in Your Website” Error in WordPress
/ 3How To Fix The “There Has Been A Critical Error in Your Website” Error in WordPress
/ -3August, 2022
How to Create a Privacy Policy Page in WordPress
/ 2April, 2022
How Long Does It Take to Learn JavaScript?
/ 1How Long Does it Take to Learn JavaScript
/ 2January, 2022
December, 2021
-
/ 6
-
/ -5
Create a JavaScript AJAX Post Request: With and Without jQuery
/ 9November, 2021
July, 2021
How to Enable or Disable a Button With JavaScript: jQuery vs. Vanilla
/ 6How to Enable or Disable a Button With JavaScript: jQuery vs Vanilla
/ -6Confirm Yes or No With JavaScript
/ -2June, 2021
How to Change the URL in JavaScript: Redirecting
/ -315+ Best WordPress Twitter Widgets
/ -2May, 2021
27 Best Tab and Accordion Widget Plugins for WordPress (Free & Premium)
/ 1221 Best Tab and Accordion Widget Plugins for WordPress (Free & Premium)
/ -830 HTML Best Practices for Beginners
/ -331 Best WordPress Calendar Plugins and Widgets (With 5 Free Plugins)
/ -425 Ridiculously Impressive HTML5 Canvas Experiments
/ -4-
/ 1
How to Implement Email Verification for New Members
/ -1How to Create a Simple Web-Based Chat Application
/ 2April, 2021
30 Popular WordPress User Interface Elements
/ -2Top 18 Best Practices for Writing Super Readable Code
/ 5Best Affiliate WooCommerce Plugins Compared
/ -3March, 2021
18 Best WordPress Star Rating Plugins
/ 910+ Best WordPress Twitter Widgets
/ -120+ Best WordPress Booking and Reservation Plugins
/ 2February, 2021
Best CSS Animations and Effects on CodeCanyon
/ -1730 CSS Best Practices for Beginners
/ -2How to Create a Custom WordPress Plugin From Scratch
/ -3May, 2020
10 Best Responsive HTML5 Sliders for Images and Text… and 3 Free Options
/ -416 Best Tab and Accordion Widget Plugins for WordPress
/ -4April, 2020
18 Best WordPress Membership Plugins and 5 Free Plugins
/ 225 Best WooCommerce Plugins for Products, Pricing, Payments and More
/ 610 Best WordPress Twitter Widgets
1 / 10March, 2020
12 Best Contact Form PHP Scripts for 2020
/ -6September, 2017
February, 2020
20 Popular WordPress User Interface Elements
/ -410 Best WordPress Star Rating Plugins
/ -7January, 2020
20 Best WordPress Calendar Plugins and Widgets
/ -1December, 2019
12 Elegant CSS Pricing Tables for Your Latest Web Project
/ 6September, 2019
14 Best PHP Event Calendar and Booking Scripts
/ -3Getting Started With Django: Newly Updated Course
/ 1July, 2019
Create a Blog for Each Category or Department in Your WooCommerce Store
/ 4April, 2019
8 Best WordPress Booking and Reservation Plugins
/ -11March, 2019
Best Exit Popups for WordPress Compared
/ 17Best Exit Popups for WordPress Compared
/ -811 Best Tab & Accordion WordPress Widgets & Plugins
/ -1112 Best Tab & Accordion WordPress Widgets & Plugins
1 / 3-

harriett What's up, after reading this awesome…
-
February, 2019
New Course: Practical React Fundamentals
/ 1January, 2019
Short Course: Better Angular App Architecture With Modules
/ 2Preview Our New Course on Angular Material
/ 3Build Your Own CAPTCHA and Contact Form in PHP
/ -3December, 2018
Object-Oriented PHP With Classes and Objects
/ -4Best Practices for ARIA Implementation
/ -3Accessible Apps: Barriers to Access and Getting Started With Accessibility
/ -7November, 2018
Dramatically Speed Up Your React Front-End App Using Lazy Loading
/ 20October, 2018
15 Best Modern JavaScript Admin Templates for React, Angular, and Vue.js
/ -715 Best Modern JavaScript Admin Templates for React, Angular and Vue.js
/ 219 Best JavaScript Admin Templates for React, Angular, and Vue.js
/ 3New Course: Build an App With JavaScript and the MEAN Stack
/ 6Hands-on With ARIA: Accessibility Recipes for Web Apps
/ 110 Best WordPress Facebook Widgets
13 / 1-
Cathleen Wonderful, what a website it is! This…
-
Sharyn Ѕimply a smiling ѵisitant heгe to…
-
shelby What's up it's me, I am also visiting…
-
Lottie I read this paragraph completely…
-
September, 2018
Hands-on With ARIA: Accessibility for eCommerce
/ -1New eBooks Available for Subscribers
/ -6Hands-on With ARIA: Homepage Elements and Standard Navigation
/ 10-
/ -3
Site Accessibility: Getting Started With ARIA
/ -2August, 2018
How Secure Are Your JavaScript Open-Source Dependencies?
/ -5New Course: Secure Your WordPress Site With SSL
/ -3Testing Components in React Using Jest and Enzyme
/ -10Testing Components in React Using Jest: The Basics
/ -5July, 2018
15 Best PHP Event Calendar and Booking Scripts
/ 2June, 2018
Create Interactive Gradient Animations Using Granim.js
/ 11How to Build Complex, Large-Scale Vue.js Apps With Vuex
1 / -6-
Frankenicerm Get exactly what you want with custom…
-
Examples of Dependency Injection in PHP With Symfony Components
/ -4May, 2018
Set Up Routing in PHP Applications Using the Symfony Routing Component
1 / 10-
romeo You certainly deserve a round of…
-
A Beginner’s Guide to Regular Expressions in JavaScript
/ 6Introduction to Popmotion: Custom Animation Scrubber
/ -5Introduction to Popmotion: Pointers and Physics
/ -14New Course: Connect to a Database With Laravel’s Eloquent ORM
/ -9How to Create a Custom Settings Panel in WooCommerce
/ -10Building the DOM faster: speculative parsing, async, defer and preload
1 / 3-
Melissa Perfect info, thanks!
-
20 Useful PHP Scripts Available on CodeCanyon
3 / 45-
darios Valuable info. Lucky me I found your…
-
Vern Link exchhange is nothing else excelt…
-
Patsy Bryan Wow, that's what I was seeking for,…
-
April, 2018
How to Find and Fix Poor Page Load Times With Raygun
/ 4Introduction to the Stimulus Framework
/ -5Single-Page React Applications With the React-Router and React-Transition-Group Modules
/ 1-
/ 6
12 Best Contact Form PHP Scripts
1 / -3-
tammie I am sure this piece of writing has…
-
Getting Started With the Mojs Animation Library: The ShapeSwirl and Stagger Modules
/ 3Getting Started With the Mojs Animation Library: The Shape Module
/ 3Getting Started With the Mojs Animation Library: The HTML Module
/ 3Project Management Considerations for Your WordPress Project
/ -78 Things That Make Jest the Best React Testing Framework
/ 3March, 2018
Creating an Image Editor Using CamanJS: Layers, Blend Modes, and Events
/ -2New Short Course: Code a Front-End App With GraphQL and React
/ 5Creating an Image Editor Using CamanJS: Applying Basic Filters
/ -7Creating an Image Editor Using CamanJS: Creating Custom Filters and Blend Modes
Modern Web Scraping With BeautifulSoup and Selenium
/ 2Challenge: Create a To-Do List in React
1-
mezo Post wrting іs allso a excitement, іf…
-
Deploy PHP Web Applications Using Laravel Forge
/ 1Getting Started With the Mojs Animation Library: The Burst Module
/ -2-
/ -8
10 Things Men Can Do to Support Women in Tech
/ 1February, 2018
A Gentle Introduction to Higher-Order Components in React: Best Practices
/ -3Challenge: Build a React Component
/ 1A Gentle Introduction to HOC in React: Learn by Example
/ -1A Gentle Introduction to Higher-Order Components in React
/ -5Creating Pretty Popup Messages Using SweetAlert2
/ -2Creating Stylish and Responsive Progress Bars Using ProgressBar.js
/ 12How to Make a Real-Time Sports Application Using Node.js
/ 1Creating a Blogging App Using Angular & MongoDB: Delete Post
/ -17Set Up an OAuth2 Server Using Passport in Laravel
/ 5Creating a Blogging App Using Angular & MongoDB: Edit Post
/ -1Creating a Blogging App Using Angular & MongoDB: Add Post
/ 2Introduction to Mocking in Python
/ -1Creating a Blogging App Using Angular & MongoDB: Show Post
/ 14Creating a Blogging App Using Angular & MongoDB: Home
/ 8-
/ 3
Creating a Blogging App Using Angular & MongoDB: Login
/ 13Creating Your First Angular App: Implement Routing
/ 5Persisted WordPress Admin Notices: Part 4
/ -3Creating Your First Angular App: Components, Part 2
/ -2Persisted WordPress Admin Notices: Part 3
/ 3How Laravel Broadcasting Works
/ 4-
/ 9
Persisted WordPress Admin Notices: Part 2
/ -6Create Your First Angular App: Storing and Accessing Data
/ 6Persisted WordPress Admin Notices: Part 1
/ -1Error and Performance Monitoring for Web & Mobile Apps Using Raygun
/ 8Using Luxon for Date and Time in JavaScript
7 / -3-
earlene This text is invaluable. How can I find…
-
amelie I needed to thank you for this great…
-
noe vance Hi, for all time i used to check…
-
brayden Pretty! This was an extremely wonderful…
-
January, 2018
How to Create an Audio Oscillator With the Web Audio API
/ -4How to Cache Using Redis in Django Applications
/ 320 Essential WordPress Utilities to Manage Your Site
/ -7Introduction to API Calls With React and Axios
/ 3Beginner’s Guide to Angular 4: HTTP
/ 13Rapid Web Deployment for Laravel With GitHub, Linode, and RunCloud.io
/ 4Beginners Guide to Angular 4: Routing
/ -12Beginner’s Guide to Angular 4: Services
/ -1Beginner’s Guide to Angular 4: Components
/ 3Creating a Drop-Down Menu for Mobile Pages
/ 4Introduction to Forms in Angular 4: Writing Custom Form Validators
/ 410 Best WordPress Booking & Reservation Plugins
/ -3Getting Started With Redux: Connecting Redux With React
/ 6Getting Started With Redux: Learn by Example
/ 13Getting Started With Redux: Why Redux?
/ 7Understanding Recursion With JavaScript
/ -2How to Auto Update WordPress Salts
/ -4How to Download Files in Python
/ 4-
/ -15
Eloquent Mutators and Accessors in Laravel
1 / 12-
mezo Ι love it whenever people get…
-
-
/ -11
December, 2017
-
/ 17
10 Best HTML5 Sliders for Images and Text
/ 6Site Authentication in Node.js: User Signup
/ 1Creating a Task Manager App Using Ionic: Part 2
/ 3Creating a Task Manager App Using Ionic: Part 1
/ 1Introduction to Forms in Angular 4: Reactive Forms
/ -2-
/ -1
Introduction to Forms in Angular 4: Template-Driven Forms
/ 225 Essential WordPress Utilities to Manage Your Site
/ -6Get Rid of Bugs Quickly Using BugReplay
1 / -18-
madison I see you don't monetize your site,…
-
Manipulating HTML5 Canvas Using Konva: Part 1, Getting Started
/ 210 Must-See Easy Digital Downloads Extensions for Your WordPress Site
22 Best WordPress Booking and Reservation Plugins
/ -2Understanding ExpressJS Routing
/ -515 Best WordPress Star Rating Plugins
/ 10Creating Your First Angular App: Basics
/ -4November, 2017
Inheritance and Extending Objects With JavaScript
/ -10Introduction to the CSS Grid Layout With Examples
1-
quito Hello. And Bye.
-
-
/ 4
Performant Animations Using KUTE.js: Part 5, Easing Functions and Attributes
/ -4Performant Animations Using KUTE.js: Part 4, Animating Text
/ -6Performant Animations Using KUTE.js: Part 3, Animating SVG
/ -11Performant Animations Using KUTE.js: Part 2, Animating CSS Properties
-
/ 1
Performant Animations Using KUTE.js: Part 1, Getting Started
/ 110 Best Responsive HTML5 Sliders for Images and Text (Plus 3 Free Options)
/ -6Single-Page Applications With ngRoute and ngAnimate in AngularJS
/ -14Deferring Tasks in Laravel Using Queues
/ -3-
/ 5
Site Authentication in Node.js: User Signup and Login
/ 5Working With Tables in React, Part Two
/ -15Working With Tables in React, Part One
/ -2How to Set Up a Scalable, E-Commerce-Ready WordPress Site Using ClusterCS
/ -6New Course on WordPress Conditional Tags
/ 2October, 2017
TypeScript for Beginners, Part 5: Generics
/ 1-
/ -9
Building With Vue.js 2 and Firebase
6 / 10-
Peden Hello! I'm at work browsing your blog…
-
cameron Very great post. I just stumbled upon…
-
juliane mckibben WOW just what I was looking for. Came…
-
carissa That is a good tip especially to those…
-
-
/ -7
-
/ 2
Essential JavaScript Libraries and Frameworks You Should Know About
/ 4-
/ 5
Vue.js Crash Course: Create a Simple Blog Using Vue.js
/ -16Build a React App With a Laravel RESTful Back End: Part 1, Laravel 5.5 API
/ 3API Authentication With Node.js
/ -4Beginner’s Guide to Angular: HTTP
/ 2Beginner’s Guide to Angular: Routing
/ -5Beginners Guide to Angular: Routing
/ -4Beginner’s Guide to Angular: Services
/ 6September, 2017
How to Create a Custom Authentication Guard in Laravel
/ 5Learn Computer Science With JavaScript: Part 3, Loops
/ -7Build Web Applications Using Node.js
/ 2Learn Computer Science With JavaScript: Part 4, Functions
/ 5Learn Computer Science With JavaScript: Part 2, Conditionals
/ 13Learn Computer Science With JavaScript: Part 1, The Basics
/ -1Create Interactive Charts Using Plotly.js, Part 5: Pie and Gauge Charts
/ -7Create Interactive Charts Using Plotly.js, Part 4: Bubble and Dot Charts
/ 6Create Interactive Charts Using Plotly.js, Part 3: Bar Charts
/ -10Awesome JavaScript Libraries and Frameworks You Should Know About
/ -3Create Interactive Charts Using Plotly.js, Part 2: Line Charts
/ -11Bulk Import a CSV File Into MongoDB Using Mongoose With Node.js
/ -4Build a To-Do API With Node, Express, and MongoDB
/ -1Getting Started With End-to-End Testing in Angular Using Protractor
/ 8TypeScript for Beginners, Part 4: Classes
/ -10Object-Oriented Programming With JavaScript
/ 710 Best Affiliate WooCommerce Plugins Compared
/ -2Stateful vs. Stateless Functional Components in React
/ 11Make Your JavaScript Code Robust With Flow
/ 1Build a To-Do API With Node and Restify
/ 8Testing Components in Angular Using Jasmine: Part 2, Services
/ 1Testing Components in Angular Using Jasmine: Part 1
/ -1Creating a Blogging App Using React, Part 6: Tags
/ -12August, 2017
React Crash Course for Beginners, Part 3
/ 3React Crash Course for Beginners, Part 2
/ 4React Crash Course for Beginners, Part 1
/ 7Set Up a React Environment, Part 4
1 / 11-
abrazil Hello, I check your blog like every…
-
Set Up a React Environment, Part 3
/ -6New Course: Get Started With Phoenix
/ -8Set Up a React Environment, Part 2
/ 2Set Up a React Environment, Part 1
/ -4Command Line Basics and Useful Tricks With the Terminal
/ 6How to Create a Real-Time Feed Using Phoenix and React
/ -3Build a React App With a Laravel Back End: Part 2, React
/ -4Build a React App With a Laravel RESTful Back End: Part 1, Laravel 9 API
/ -3Creating a Blogging App Using React, Part 5: Profile Page
/ -5Pagination in CodeIgniter: The Complete Guide
/ 23JavaScript-Based Animations Using Anime.js, Part 4: Callbacks, Easings, and SVG
/ 2JavaScript-Based Animations Using Anime.js, Part 3: Values, Timeline, and Playback
/ 1July, 2017
10 Elegant CSS Pricing Tables for Your Latest Web Project
/ -10Getting Started With the Flux Architecture in React
/ -6Getting Started With Matter.js: The Composites and Composite Modules
/ 1Getting Started With Matter.js: The Engine and World Modules
/ 1110 More Popular HTML5 Projects for You to Use and Study
/ -18Understand the Basics of Laravel Middleware
/ -3Iterating Fast With Django & Heroku
/ 12Creating a Blogging App Using React, Part 4: Update & Delete Posts
/ 2Creating a jQuery Plugin for Long Shadow Design
/ -11How to Register & Use Laravel Service Providers
2 / -7-
alexandria Hi, its fastidious article on the topic…
-
soi keo I always spent my half an hour to read…
-
Unit Testing in React: Shallow vs. Static Testing
/ 4Creating a Blogging App Using React, Part 3: Add & Display Post
/ 11June, 2017
Creating a Blogging App Using React, Part 2: User Sign-Up
20 / -3-
carris This piece of writing presents clear…
-
marissa Great write-up, I am normal visitor of…
-
ena As a Newbie, I am always exploring…
-
beth Thank you for another fantastic post.…
-
Creating a Blogging App Using React, Part 1: User Sign-In
/ 29 More Popular HTML5 Projects for You to Use and Study
/ 4Creating a Grocery List Manager Using Angular, Part 2: Managing Items
/ 39 Elegant CSS Pricing Tables for Your Latest Web Project
/ -6Dynamic Page Templates in WordPress, Part 3
/ -1Angular vs. React: 7 Key Features Compared
/ 6Creating a Grocery List Manager Using Angular, Part 1: Add & Display Items
/ -1New eBooks Available for Subscribers in June 2017
/ 4Create Interactive Charts Using Plotly.js, Part 1: Getting Started
/ 10The 5 Best IDEs for WordPress Development (And Why)
/ -433 Popular WordPress User Interface Elements
/ -1New Course: How to Hack Your Own App
/ -10How to Install Yii on Windows or a Mac
/ -1What Is a JavaScript Operator?
/ -2How to Register and Use Laravel Service Providers
/ 8
waly Good blog post. I absolutely love this…